United States
Comparing the Size of The World’s Rockets, Past and Present
View the full-size version of this infographic
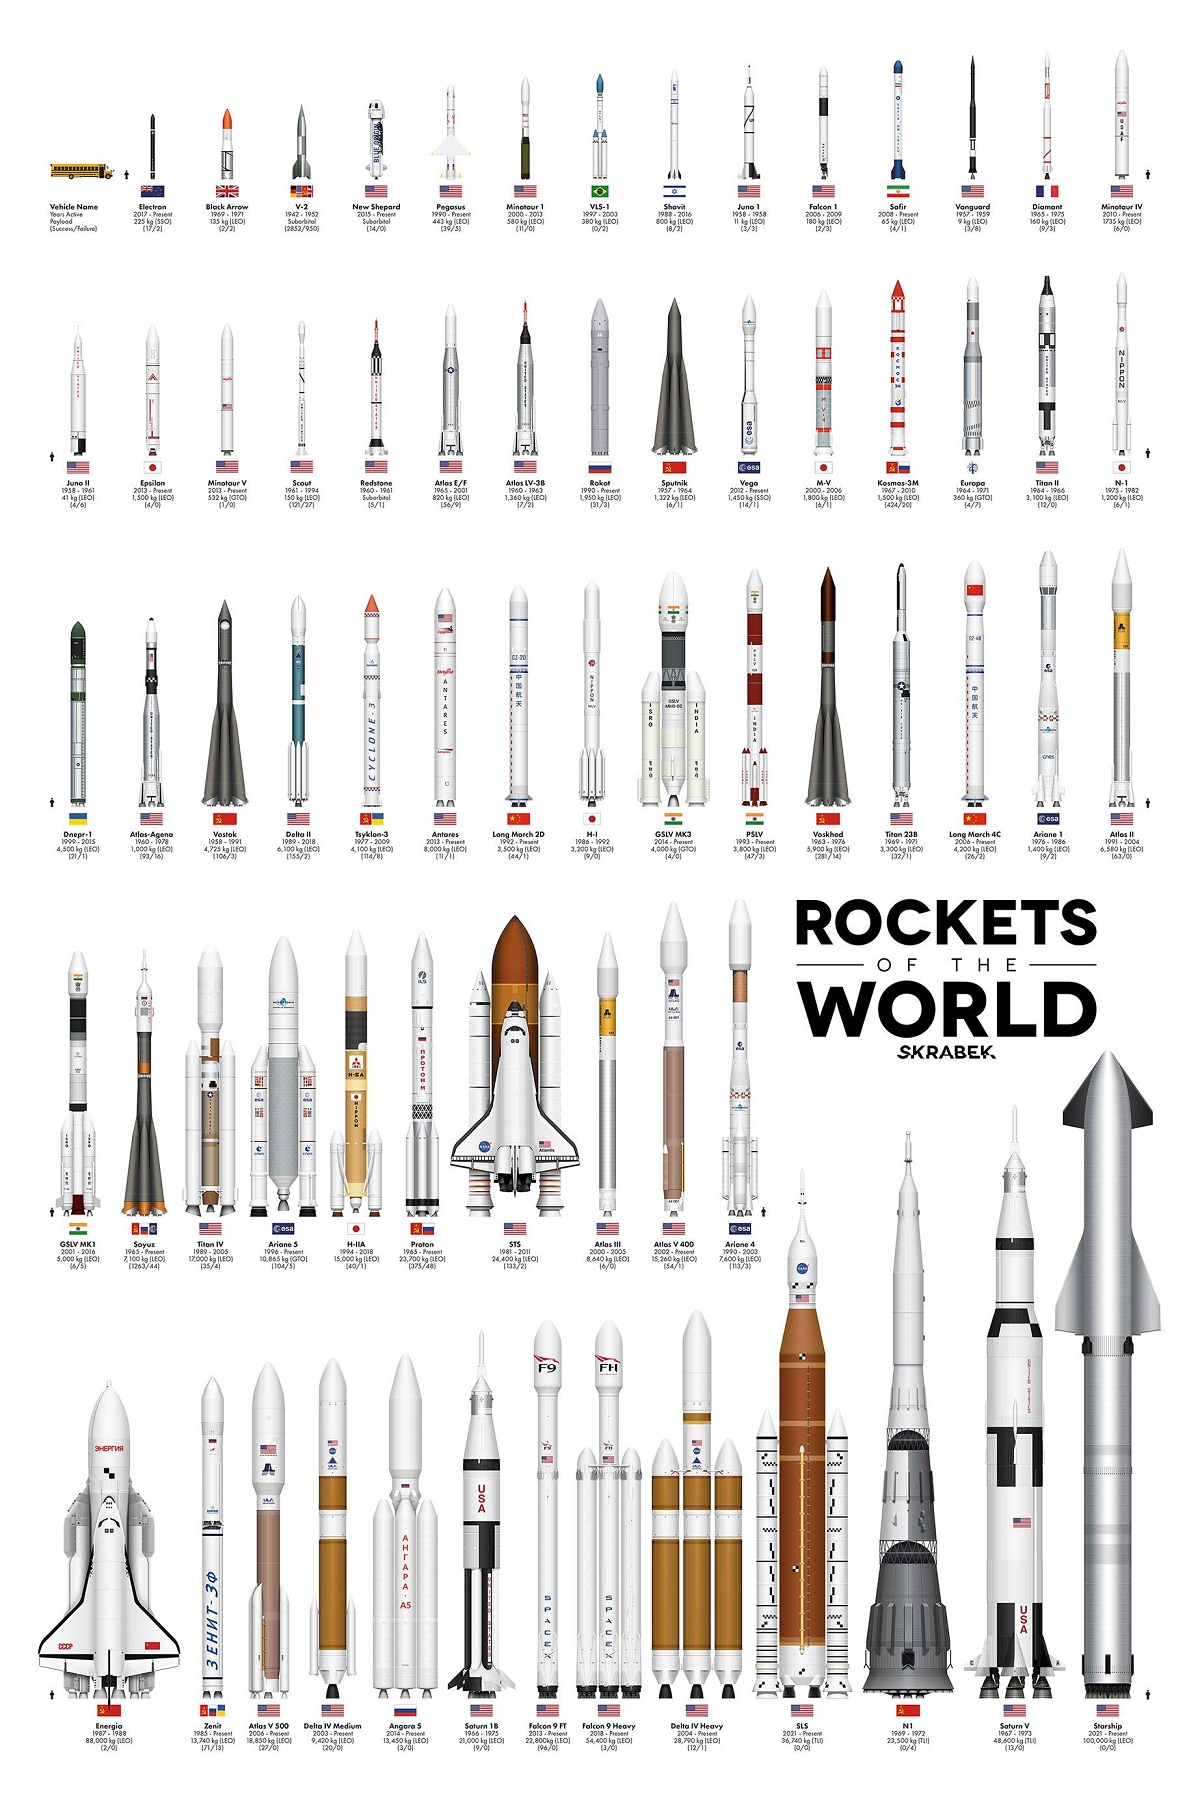
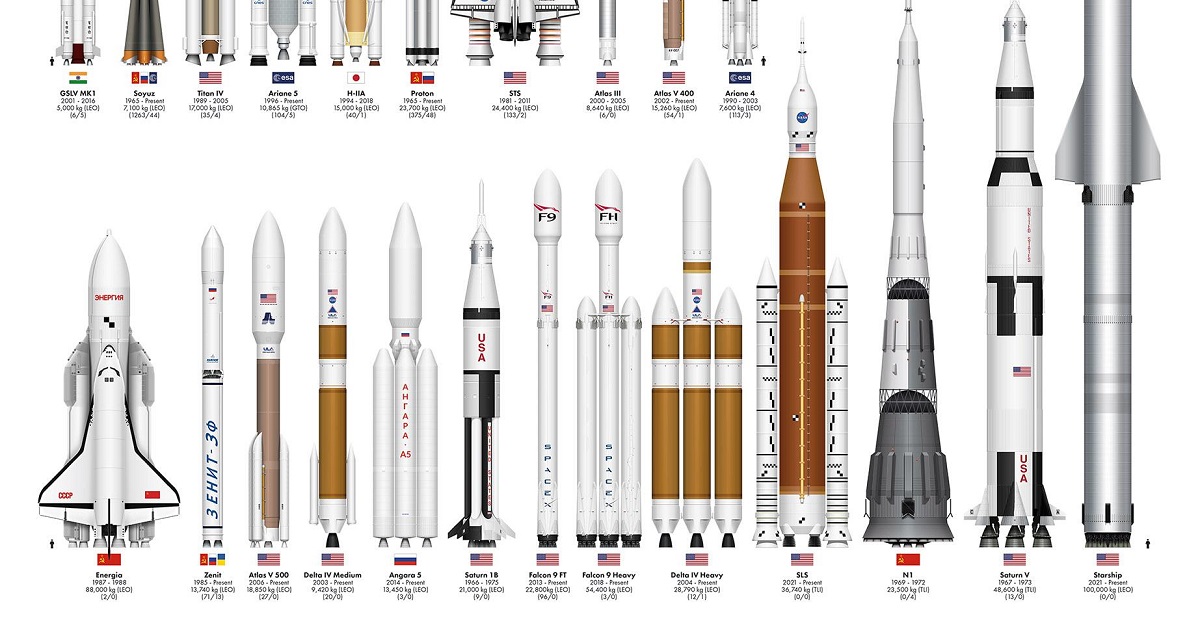
The Size of The World’s Rockets, Past and Present
The SpaceX Starship might be the next rocket to take humans to the moon, but it won’t be the first, and likely not the last.
Starting in the mid-20th century, humanity has explored space faster than ever before. We’ve launched satellites, telescopes, space stations, and spacecrafts, all strapped to rocket-propelled launch vehicles that helped them breach our atmosphere.
This infographic from designer Tyler Skarbek stacks up the many different rockets of the world side-by-side, showing which country designed them, what years they were used, and what they (could) accomplish.
How Do The World’s Rockets Stack Up?
Before they were used for space travel, rockets were produced and developed to be used as ballistic missiles.
The first rocket to officially reach space—defined by the Fédération Aéronautique Internationale as crossing the Kármán line at 100 kilometers (62 miles) above Earth’s mean sea level—was the German-produced V-2 rocket in 1944.
But after World War II, V-2 production fell into the hands of the U.S., the Soviet Union (USSR), and the UK.
Over the next few decades and the unfolding of the Cold War, what started as a nuclear arms race of superior ballistic missiles turned into the Space Race. Both the U.S. and the USSR tried to be the first to achieve and master spaceflight, driving production of many new and different rockets.
| Origin Country | Rocket | Years Active | Payload (Range) | Success/Failure |
|---|---|---|---|---|
| Germany | V-2 | 1942–1952 | (Suborbital) | 2852/950 |
| U.S. | Vanguard | 1957–1959 | 9 kg (LEO) | 3/8 |
| USSR | Sputnik | 1957–1964 | 1,322 kg (LEO) | 6/1 |
| U.S. | Juno 1 | 1958–1958 | 11 kg (LEO) | 3/3 |
| U.S. | Juno II | 1958–1961 | 41 kg (LEO) | 4/6 |
| USSR | Vostok | 1958–1991 | 4,725 kg (LEO) | 106/3 |
| U.S. | Redstone | 1960–1961 | 1,800 kg (Suborbital) | 5/1 |
| U.S. | Atlas LV-3B | 1960–1963 | 1,360 kg (LEO) | 7/2 |
| U.S. | Atlas-Agena | 1960–1978 | 1,000 kg (LEO) | 93/16 |
| U.S. | Scout | 1961–1994 | 150 kg (LEO) | 121/27 |
| USSR | Voskhod | 1963–1976 | 5,900 kg (LEO) | 281/14 |
| U.S. | Titan II | 1964–1966 | 3,100 kg (LEO) | 12/0 |
| Europe (ELDO) | Europa | 1964–1971 | 360 kg (GTO) | 4/7 |
| France | Diamant | 1965–1975 | 160 kg (LEO) | 9/3 |
| U.S. | Atlas E/F | 1965–2001 | 820 kg (LEO) | 56/9 |
| USSR | Soyuz | 1965–Present | 7,100 kg (LEO) | 1263/44 |
| USSR | Proton | 1965–Present | 23,700 kg (LEO) | 375/48 |
| U.S. | Saturn 1B | 1966–1975 | 21,000 kg (LEO) | 9/0 |
| U.S. | Saturn V | 1967–1973 | 48,600 kg (TLI) | 13/0 |
| USSR | Kosmos-3M | 1967–2010 | 1,500 kg (LEO) | 424/20 |
| UK | Black Arrow | 1969–1971 | 135 kg (LEO) | 2/2 |
| U.S. | Titan 23B | 1969–1971 | 3,300 kg (LEO) | 32/1 |
| USSR | N1 | 1969–1972 | 23,500 kg (TLI) | 0/4 |
| Japan | N-1 | 1975–1982 | 1,200 kg (LEO) | 6/1 |
| Europe (ESA) | Ariane 1 | 1976–1986 | 1,400 kg (LEO) | 9/2 |
| USSR | Tsyklon-3 | 1977–2009 | 4,100 kg (LEO) | 114/8 |
| U.S. | STS | 1981–2011 | 24,400 kg (LEO) | 133/2 |
| USSR | Zenit | 1985–Present | 13,740 kg (LEO) | 71/13 |
| Japan | H-I | 1986–1992 | 3,200 kg (LEO) | 9/0 |
| USSR | Energia | 1987–1988 | 88,000 kg (LEO) | 2/0 |
| Israel | Shavit | 1988–2016 | 800 kg (LEO) | 8/2 |
| U.S. | Titan IV | 1989–2005 | 17,000 kg (LEO) | 35/4 |
| U.S. | Delta II | 1989–2018 | 6,100 kg (LEO) | 155/2 |
| Europe (ESA) | Ariane 4 | 1990–2003 | 7,600 kg (LEO) | 113/3 |
| U.S. | Pegasus | 1990–Present | 443 kg (LEO) | 39/5 |
| Russia | Rokot | 1990–Present | 1,950 kg (LEO) | 31/3 |
| U.S. | Atlas II | 1991–2004 | 6,580 kg (LEO) | 63/0 |
| China | Long March 2D | 1992–Present | 3,500 kg (LEO) | 44/1 |
| India | PSLV | 1993–Present | 3,800 kg (LEO) | 47/3 |
| Japan | H-IIA | 1994–2018 | 15,000 kg (LEO) | 40/1 |
| Europe (ESA) | Ariane 5 | 1996–Present | 10,865 kg (GTO) | 104/5 |
| Brazil | VLS-1 | 1997–2003 | 380 kg (LEO) | 0/2 |
| USSR | Dnepr-1 | 1999–2015 | 4,500 kg (LEO) | 21/1 |
| U.S. | Atlas III | 2000–2005 | 8,640 kg (LEO) | 6/0 |
| Japan | M-V | 2000–2006 | 1,800 kg (LEO) | 6/1 |
| U.S. | Minotaur 1 | 2000–2013 | 580 kg (LEO) | 11/0 |
| India | GSLV MK1 | 2001–2016 | 5,000 kg (LEO) | 6/5 |
| U.S. | Atlas V 400 | 2002–Present | 15,260 kg (LEO) | 54/1 |
| U.S. | Delta IV Medium | 2003–Present | 9,420 kg (LEO) | 20/0 |
| U.S. | Delta IV Heavy | 2004–Present | 28,790 kg (LEO) | 12/1 |
| U.S. | Falcon 1 | 2006–2009 | 180 kg (LEO) | 2/3 |
| China | Long March 4C | 2006–Present | 4,200 kg (LEO) | 26/2 |
| U.S. | Atlas V 500 | 2006–Present | 18,850 kg (LEO) | 27/0 |
| Iran | Safir | 2008–Present | 65 kg (LEO) | 4/1 |
| U.S. | Minotaur IV | 2010–Present | 1,735 kg (LEO) | 6/0 |
| Europe (ESA) | Vega | 2012–Present | 1,450 kg (SSO) | 14/1 |
| U.S. | Minotaur V | 2013–Present | 532 kg (GTO) | 1/0 |
| Japan | Epsilon | 2013–Present | 1,500 kg (LEO) | 4/0 |
| U.S. | Antares | 2013–Present | 8,000 kg (LEO) | 11/1 |
| U.S. | Falcon 9 FT | 2013–Present | 22,800 kg (LEO) | 96/0 |
| India | GSLV MK3 | 2014–Present | 4,000 kg (GTO) | 4/0 |
| Russia | Angara 5 | 2014–Present | 13,450 kg (LEO) | 3/0 |
| U.S. | New Shepard | 2015–Present | (Suborbital) | 14/0 |
| New Zealand | Electron | 2017–Present | 225 kg (SSO) | 17/2 |
| U.S. | Falcon 9 Heavy | 2018–Present | 54,400 kg (LEO) | 3/0 |
| U.S. | Starship | 2021–Present | 100,000 kg (LEO) | 0/0 |
| U.S. | SLS | 2021–Present | 36,740 kg (TLI) | 0/0 |
As the Space Race wound down, the U.S. proved to be the biggest producer of different rockets. The eventual dissolution of the USSR in 1991 transferred production of Soviet rockets to Russia or Ukraine. Then later, both Europe (through the European Space Agency) and Japan ramped up rocket production as well.
More recently, new countries have since joined the race, including China, Iran, and India. Though the above infographic shows many different families of rockets, it doesn’t include all, including China’s Kuaizhou rocket and Iran’s Zuljanah and Qased rockets.
Rocket Range Explained and Continued Space Aspirations
Designing a rocket that can reach far into space while carrying a heavy payload—the objects or entities being carried by a vehicle—is extremely difficult and precise. It’s not called rocket science for nothing.
When rockets are designed, they are are created with one specific range in mind that takes into account the fuel needed to travel and velocity achievable. Alternatively, they have different payload ratings depending on what’s achievable and reliable based on the target range.
- Suborbital: Reaches outer space, but its trajectory intersects the atmosphere and comes back down. It won’t be able to complete an orbital revolution or reach escape velocity.
- LEO (Low Earth orbit): Reaches altitude of up to ~2,000 km (1242.74 miles) and orbits the Earth at an orbital period of 128 minutes or less (or 11.25 orbits per day).
- SSO (Sun-synchronous orbit): Reaches around 600–800 km above Earth in altitude but orbits at an inclination of ~98°, or nearly from pole to pole, in order to keep consistent solar time.
- GTO (Geosynchronous transfer orbit): Launches into a highly elliptical orbit which gets as close in altitude as LEO and as far away as 35,786 km (22,236 miles) above sea level.
- TLI (Trans-lunar injection): Launches on a trajectory (or accelerates from Earth orbit) to reach the Moon, an average distance of 384,400 km (238,900 miles) from Earth.
But there are other ranges and orbits in the eyes of potential spacefarers. Mars for example, a lofty target in the eyes of SpaceX and billionaire founder Elon Musk, is between about 54 and 103 million km (34 and 64 million miles) from Earth at its closest approach.
With space exploration becoming more common, and lucrative enough to warrant billion-dollar lawsuits over contract awards, how far will future rockets go?


Misc
The Top 25 Nationalities of U.S. Immigrants
Mexico is the largest source of immigrants to the U.S., with almost 11 million immigrants.


The Top 25 Nationalities of U.S. Immigrants
This was originally posted on our Voronoi app. Download the app for free on iOS or Android and discover incredible data-driven charts from a variety of trusted sources.
The United States is home to more than 46 million immigrants, constituting approximately 14% of its total population.
This graphic displays the top 25 countries of origin for U.S. immigrants, based on 2022 estimates. The data is sourced from the Migration Policy Institute (MPI), which analyzed information from the U.S. Census Bureau’s 2022 American Community Survey.
In this context, “immigrants” refer to individuals residing in the United States who were not U.S. citizens at birth.
Mexico Emerges as a Leading Source of Immigration
Mexico stands out as the largest contributor to U.S. immigration due to its geographical proximity and historical ties.
Various economic factors, including wage disparities and employment opportunities, motivate many Mexicans to seek better prospects north of the border.
| Country | Region | # of Immigrants |
|---|---|---|
| 🇲🇽 Mexico | Latin America & Caribbean | 10,678,502 |
| 🇮🇳 India | Asia | 2,839,618 |
| 🇨🇳 China | Asia | 2,217,894 |
| 🇵🇭 Philippines | Asia | 1,982,333 |
| 🇸🇻 El Salvador | Latin America & Caribbean | 1,407,622 |
| 🇻🇳 Vietnam | Asia | 1,331,192 |
| 🇨🇺 Cuba | Latin America & Caribbean | 1,312,510 |
| 🇩🇴 Dominican Republic | Latin America & Caribbean | 1,279,900 |
| 🇬🇹 Guatemala | Latin America & Caribbean | 1,148,543 |
| 🇰🇷 Korea | Asia | 1,045,100 |
| 🇨🇴 Colombia | Latin America & Caribbean | 928,053 |
| 🇭🇳 Honduras | Latin America & Caribbean | 843,774 |
| 🇨🇦 Canada | Northern America | 821,322 |
| 🇯🇲 Jamaica | Latin America & Caribbean | 804,775 |
| 🇭🇹 Haiti | Latin America & Caribbean | 730,780 |
| 🇬🇧 United Kingdom | Europe | 676,652 |
| 🇻🇪 Venezuela | Latin America & Caribbean | 667,664 |
| 🇧🇷 Brazil | Latin America & Caribbean | 618,525 |
| 🇩🇪 Germany | Europe | 537,484 |
| 🇪🇨 Ecuador | Latin America & Caribbean | 518,287 |
| 🇵🇪 Peru | Latin America & Caribbean | 471,988 |
| 🇳🇬 Nigeria | Africa | 448,405 |
| 🇺🇦 Ukraine | Europe | 427,163 |
| 🇮🇷 Iran | Middle East | 407,283 |
| 🇵🇰 Pakistan | Asia | 399,086 |
| Rest of World | 11,637,634 | |
| Total | 46,182,089 |
Mexicans are followed in this ranking by Indians, Chinese, and Filipinos, though most immigrants on this list come from countries in the Latin American and Caribbean region.
On the other hand, only three European countries are among the top sources of U.S. immigrants: the UK, Germany, and Ukraine.
Immigration continues to be a significant factor contributing to the overall growth of the U.S. population. Overall population growth has decelerated over the past decade primarily due to declining birth rates.
Between 2021 and 2022, the increase in the immigrant population accounted for 65% of the total population growth in the U.S., representing 912,000 individuals out of nearly 1.4 million.
If you enjoyed this post, be sure to check out Visualized: Why Do People Immigrate to the U.S.? This visualization shows the different reasons cited by new arrivals to America in 2021.

-

 Personal Finance1 week ago
Visualizing the Tax Burden of Every U.S. State
-

 Misc6 days ago
Visualized: Aircraft Carriers by Country
-

 Culture7 days ago
How Popular Snack Brand Logos Have Changed
-

 Mining1 week ago
Visualizing Copper Production by Country in 2023
-

 Politics1 week ago
Charted: How Americans Feel About Federal Government Agencies
-

 Healthcare1 week ago
Which Countries Have the Highest Infant Mortality Rates?
-

 Demographics1 week ago
Mapped: U.S. Immigrants by Region
-

 Economy1 week ago
Mapped: Southeast Asia’s GDP Per Capita, by Country